Login using Social Account
Login using your credentials
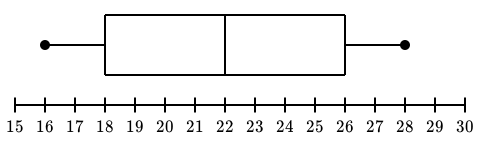
In the below box plot, select the maximum value
16
18
22
26
28
Taking you to the next exercise in seconds...
Stay here Next Exercise
Want to create exercises like this yourself? Click here.
Note - Having trouble with the assessment engine? Follow the steps listed here
Answer is not availble for this assesment
1 Analytics - Probability and Statistics
2 Data Visualization, Data Cleaning and Feature Scaling
3 Probability - Two Sundays in a Week
4 Probability - Getting Head in the Fair Coin Toss
5 Probability of an Event
6 Mode - Question 1
7 Mode - Question 2
8 Box Plot - Minimum Value
9 Box Plot - Maximum Value
10 Box Plot - Median Value or Quartile Q2
11 Box Plot - Quartile Q1
12 Box Plot - Quartile Q3
13 Box Plot - Interquartile Range
14 Measures of Central Tendency
15 Variance
16 Normal Distribution
17 Correlation
18 Correlation Coefficient
19 Data Cleaning
20 Feature Scaling
21 Standardization
22 Min-max Scaling
23 Min-max Vs Standardization

Loading comments...