

In this blog post, we will learn how to build a real-time analytics dashboard using Apache Spark streaming, Kafka, Node.js, Socket.IO and Highcharts.
Complete Spark Streaming topic on CloudxLab to refresh your Spark Streaming and Kafka concepts to get most out of this guide.
Problem Statement
An e-commerce portal (http://www.aaaa.com) wants to build a real-time analytics dashboard to visualize the number of orders getting shipped every minute to improve the performance of their logistics.
Solution
Before working on the solution, let’s take a quick look at all the tools we will be using:
Apache Spark – A fast and general engine for large-scale data processing. It is 100 times faster than Hadoop MapReduce in memory and 10x faster on disk. Learn more about Apache Spark here
Python – Python is a widely used high-level, general-purpose, interpreted, dynamic programming language. Learn more about Python here
Kafka – A high-throughput, distributed, publish-subscribe messaging system. Learn more about Kafka here
Node.js – Event-driven I/O server-side JavaScript environment based on V8. Learn more about Node.js here
Socket.IO – Socket.IO is a JavaScript library for real-time web applications. It enables real-time, bi-directional communication between web clients and servers. Read more about Socket.IO here
Highcharts – Interactive JavaScript charts for web pages. Read more about Highcharts here
CloudxLab – Provides a real cloud-based environment for practicing and learn various tools. You can start practicing right away by just signing up online.
How To Build A Data Pipeline?
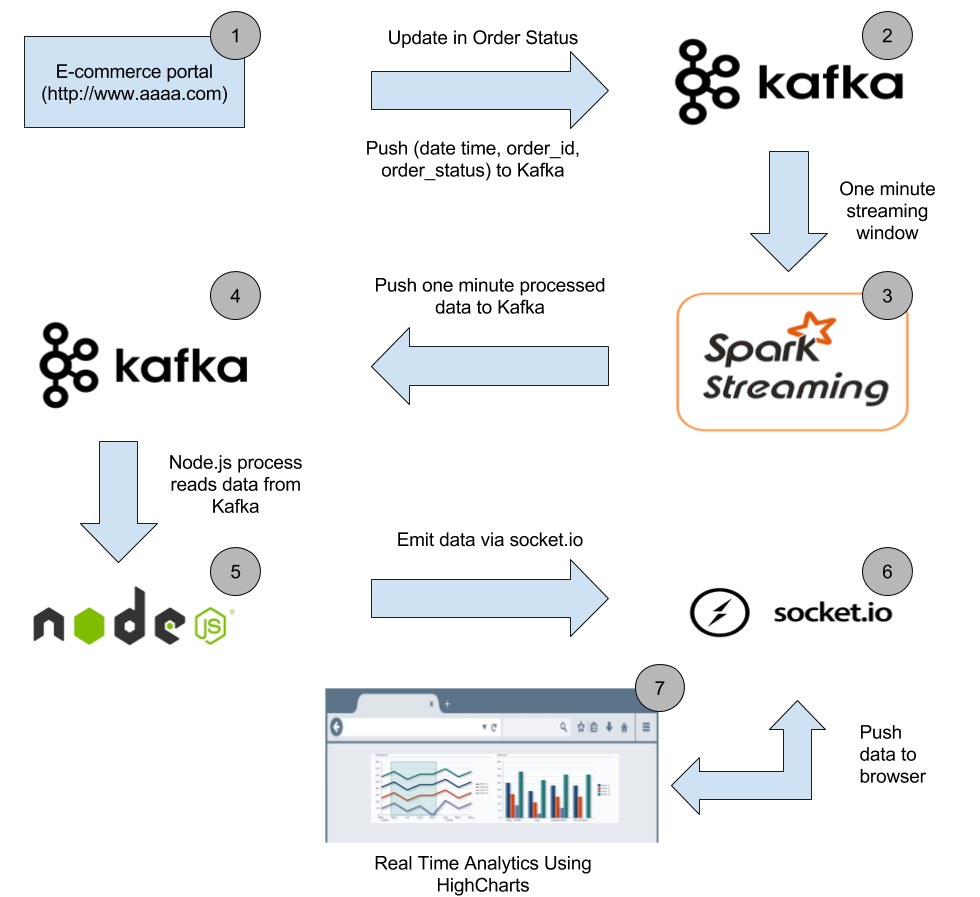
Below is the high-level architecture of the data pipeline
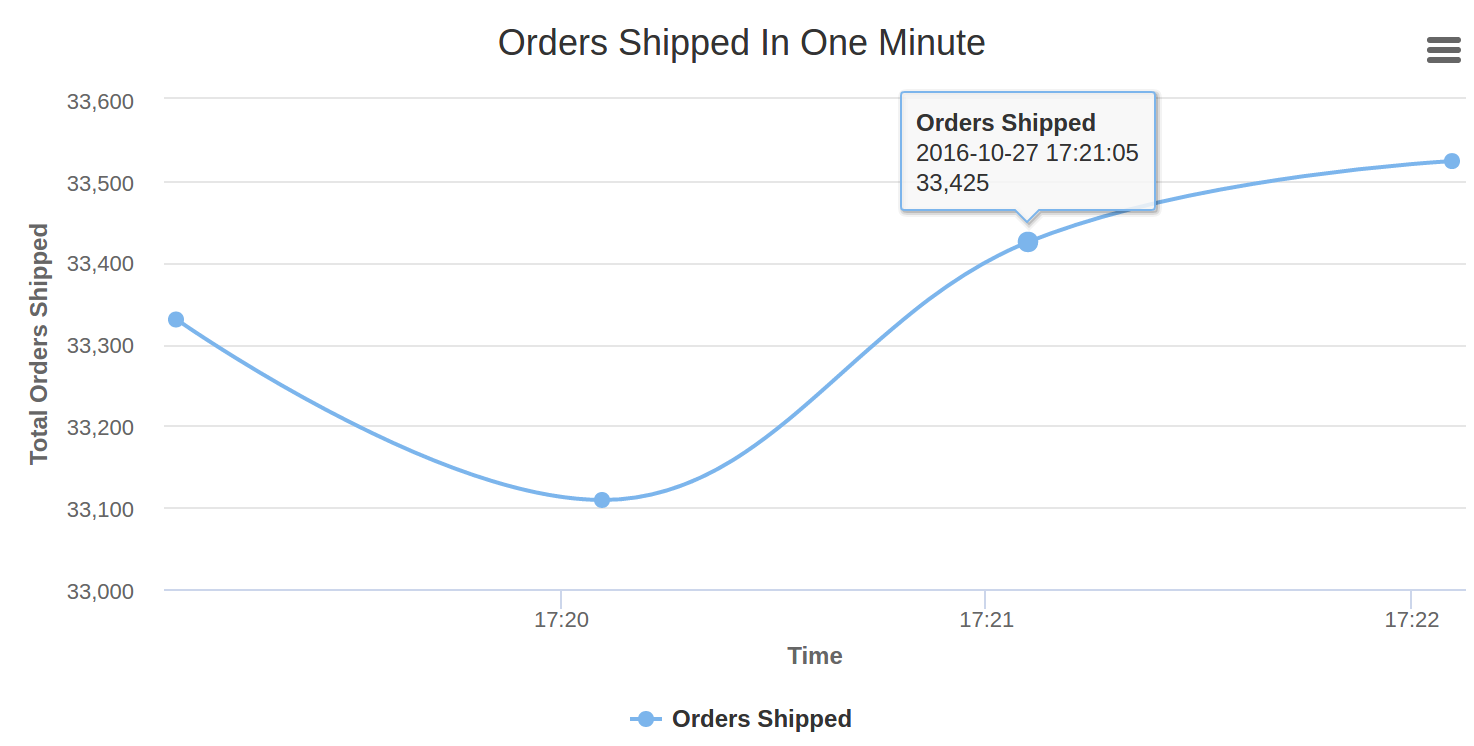
Our real-time analytics dashboard will look like this
Let’s start with the description of each stage in the data pipeline and build the solution.
Stage 1
When a customer buys an item or an order status changes in the order management system, the corresponding order id along with the order status and time get pushed to the Kafka topic.
Dataset
Since we do not have an online e-commerce portal in place, we have prepared a dataset containing CSV files. Let’s have a look at the dataset
DateTime, OrderId, Status
2016-07-13 14:20:33,xxxxx-xxx,processing
2016-07-13 14:20:34,xxxxx-xxx,shipped
2016-07-13 14:20:35,xxxxx-xxx,delivered
Our dataset contains three columns ‘DateTime’, ‘OrderId’ & ‘Status’. Each row in the dataset represents the order status in particular date time. Here we have masked OrderId with “xxxxx-xxx”. We are only interested in the number of orders getting shipped every minute, so we do not need the actual order id.
The entire source code for the solution and dataset can be cloned from CloudxLab GitHub repository.
The dataset is located at spark/projects/real-time-analytics dashboard/data/order_data directory in the above repository.
Push Dataset to Kafka
A shell script takes each row of these CSV files and pushes to Kafka. It waits for one minute to push the next CSV file to Kafka so that we can simulate the real-time e-commerce portal environment where an order status gets changed at different time intervals. In a real world scenario, when an order status changes, the corresponding order details gets pushed to Kafka.
Watch below video to understand how to use Kafka on CloudxLab.
Let’s run our shell script to push data to Kafka topic. Login to CloudxLab web console and run below commands.
# Clone the repository if you haven't cloned it yet.

git clone https://github.com/singhabhinav/cloudxlab.git && cd cloudxlab

# If you have already cloned the repository then update the repository

cd cloudxlab && git pull origin master

# Export Kafka binaries

export PATH=$PATH:/usr/hdp/current/kafka-broker/bin

# Create Kafka topic with your username.
# Let's say your CloudxLab username is abhinav9884
# Create topic with name abhinav9884-order-data
# Replace order-data with your topic name
# Replace localhost with the hostname where zookeeper server is running.
# Watch above video to find out the hostname of zookeeper server

kafka-topics.sh --create --zookeeper localhost:2181 --replication-factor 1 --partitions 1 --topic order-data

# Go to Kafka directory

cd spark/projects/real-time-analytics-dashboard/kafka


# Lets first find the ip of one of the kafka brokers.

# Locate the kafka brokers

# The kafka brokers inform zookeeper about their IPs adresses. Most of the eco-system considers the zookeeper as a central registry.

# First launch zookeeper client

zookeeper-client

# I found the for me the location of one of the brokers was ip-172-xx-xx-xxx.ec2.internal:6667

# find the ip address of any broker from zookeeper-client using command get /brokers/ids/0

# On the zookeeper-client prompt, list all the brokers that registered

ls /brokers/ids

# Now, get the information about all the ids using the get command with the nodes listed in previous command

# For example:

get /brokers/ids/1001
get /brokers/ids/1002
get /brokers/ids/1003

# Exit zookeeper-client now. Press "Ctrl + D"

# Run the script to push data to Kafka topic
# Replace localhost with the ip of any broker
# Watch above video to find the broker hostname
# Replace order-data with your created topic.

/bin/bash put_order_data_in_topic.sh ../data/order_data/ localhost:6667 order-data

# Script pushes CSV files one by one to Kafka topic in one-minute interval
# Let the script run. Do not close the terminal
Stage 2
After stage 1 each message in Kafka topic looks something like this
2016-07-13 14:20:33,xxxxx-xxx,processing
Stage 3
Watch below video to learn Spark Streaming and Kafka integration
Spark streaming code takes data from Kafka topic in a window of 60 seconds, process it so that we have the total count of each unique order status in that 60 seconds window. After processing the total count of each unique order status gets pushed to new Kafka topic (Create a new topic with your username say abhinav9884-order-one-min-data)
Run below commands in web console to create a one minute Kafka topic and run the spark streaming code
# Login to CloudxLab web console in the second tab

cd ~/cloudxlab

# Export Kafka binaries

export PATH=$PATH:/usr/hdp/current/kafka-broker/bin

# Create new Kafka topic which will store the total count of unique order status in 60 seconds windows
# Create it with your username such as abhinav9884-order-one-min-data
# Replace localhost with the hostname where zookeeper server is running
# Replace order-one-min-data with your new topic

kafka-topics.sh --create --zookeeper localhost:2181 --replication-factor 1 --partitions 1 --topic order-one-min-data

# Let's run the Spark Streaming code

# Go to spark directory

cd spark/projects/real-time-analytics-dashboard/spark

# Run Spark Streaming code
# Open spark_streaming_order_status.py using vi or nano and change order-one-min-data to your new one minute Kafka topic say abhinav9884-order-one-min-data
# Save the spark_streaming_order_status.py file
# Replace localhost with the hostname where zookeeper server is running
# Replace order-data with your first topic name abhinav9884-order-data
# In the spark_streaming_order_status.py change the hosts to one of the broker ip. For example
# client = KafkaClient(hosts="cxln2.c.thelab-240901.internal:6667")

spark-submit --packages org.apache.spark:spark-streaming-kafka-0-8_2.11:2.0.2 spark_streaming_order_status.py localhost:2181 order-data

# Let the script run. Do not close the terminal
Stage 4
In this stage, each message in the new Kafka topic ‘abhinav9884-order-one-min-data’ looks something like the below JSON payload
{
    "shipped": 657,
    "processing": 987,
    "delivered": 1024
}
Stage 5
Run Node.js server
Now we start a Node.js server to consume messages from one minute Kafka topic and push it to the web browser so that we can display the number of orders getting shipped per minute in the web browser.
Run below commands in web console to start the Node.js server
# Login to CloudxLab web console in the third tab

cd ~/cloudxlab

# Go to node directory

cd spark/projects/real-time-analytics-dashboard/node

# Install dependencies as specified in package.json

npm install

# Open index.js using vi or nano
# Replace localhost with zookeeper server hostname
# Replace order-min-data with abhinav9884-order-one-min-data
# Save the file

# Run the node server

node index.js

# Let the server run. Do not close the terminal
Node server starts on port 3001. If there is an ‘EADDRINUSE’ error while starting the node server, please edit the index.js file and change the port to 3002 …3003 ..3004 and so on until you find the next available port. Please use any of the available ports in 3001-3010 range to run the node server.
Access from browser
After node server is started, go to http://YOUR_WEB_CONSOLE:PORT_NUMBER to access the real-time analytics dashboard. If your web console is f.cloudxlab.com and your node server is running on port 3002, go to http://f.cloudxlab.com:3002 to access the dashboard.
When we access the above URL, socket.io-client library gets loaded on the browser which enables the bi-directional communication channel between the server and the browser.
Stage 6
As soon as a new message is available in the one minute Kafka topic, node process consumes it. The consumed message then gets emitted to the web browser via Socket.IO
Stage 7
As soon as socket.io-client in the web browser receives a new ‘message’ event, data in the event gets processed. If the order status is “shipped” in the received data, it gets added to HighCharts series and gets displayed on the browser.
Screencast
We’ve also recorded a screencast on how one can run all the above commands and build the real-time analytics dashboard
We have successfully built the real-time analytics dashboard. This was a basic example to show how can we integrate Spark Streaming, Kafka, Node.js, and Socket.IO to build a real-time analytics dashboard. Now, since we know the basics, we can build more complex systems using the above tools.
Hope this guide was helpful. Please feel free to leave your comments. Follow CloudxLab on Twitter to get updates on new blogs and videos.
About authors

Seasoned hands-on technical architect with years of experience in building large scale products for a global audience and India

Seasoned hands-on technical architect with years of strong experience in building world- class software products
Interesting read 🙂
Glad to know that you liked it 🙂
Hi i am working on Kafka spark streaming using node js same related to this article
can you please provide code in more detail
Hi Ramacharan,
Just curious, in which part you are looking more detail.
You can send me an email at abhinav at cloudxlab dot com and we can discuss the improvements.
Im able to produce and consume data from kafka but i want to process data streaming using spark using node js client
Im completely new to spark streaming so am not able to find a solution to integrate kafka and spark using node js client
Hi Ramcharan,
We can connect over email. Later I will update the post with summary of our discussion so that it will be useful to other users also
Hi Abinav,
Could you please share the completed post, so that new users like us will refer into it?
Hi Dinesh,
This is the complete blog post. Just curious if you have found any thing missing in the post. Feel free to share your thoughts so that I can improve it.
Hi Dinesh,
This is the complete blog post. Just curious if you have found any thing missing in the post. Feel free to share your thoughts so that I can improve it.
Hi Ramcharan,
I have updated the code and guide.
Please check it now and keep me updated.
One suggestion – try to write one name other than ‘order-data’, like ‘order-data-1000’ … or you cannot push successfully. But I got events.js:74 after I run ‘node index.js’, I don not know why
One suggestion – try to write one name other than ‘order-data’, like ‘order-data-1000’ … or you cannot push successfully. But I got events.js:74 after I run ‘node index.js’, I don not know why
Hi,
Sorry I missed your comment. Let me check it out.
Hi,
I have updated the code and guide.
Can you please check now? It should work.
Please keep me updated.
Hello Team,
I tried to start the node client for Viewing the orders but everytime it fails with below error
Running on port 3008
express deprecated res.sendfile: Use res.sendFile instead index.js:16:9
a user connected
events.js:74
throw TypeError(‘Uncaught, unspecified “error” event.’);
^
TypeError: Uncaught, unspecified “error” event.
at TypeError ()
at emit (events.js:74:15)
at /home/svaheguru2242/cloudxlab/spark/projects/real-time-analytics-dashboard/node/node_modules/kafka-node/lib/highLevelConsumer.js:178:36
at null. (/home/svaheguru2242/cloudxlab/spark/projects/real-time-analytics-dashboard/node/node_modules/kafka-node/lib/client.js
:364:28)
at Client.handleReceivedData (/home/svaheguru2242/cloudxlab/spark/projects/real-time-analytics-dashboard/node/node_modules/kafka-node/lib/
client.js:587:18)
at Socket. (/home/svaheguru2242/cloudxlab/spark/projects/real-time-analytics-dashboard/node/node_modules/kafka-node/lib/client.
js:550:14)
at Socket.emit (events.js:95:17)
at Socket. (_stream_readable.js:765:14)
at Socket.emit (events.js:92:17)
at emitReadable_ (_stream_readable.js:427:10)
Hello Team,
I tried to start the node client for Viewing the orders but everytime it fails with below error
Running on port 3008
express deprecated res.sendfile: Use res.sendFile instead index.js:16:9
a user connected
events.js:74
throw TypeError(‘Uncaught, unspecified “error” event.’);
^
TypeError: Uncaught, unspecified “error” event.
at TypeError ()
at emit (events.js:74:15)
at /home/svaheguru2242/cloudxlab/spark/projects/real-time-analytics-dashboard/node/node_modules/kafka-node/lib/highLevelConsumer.js:178:36
at null. (/home/svaheguru2242/cloudxlab/spark/projects/real-time-analytics-dashboard/node/node_modules/kafka-node/lib/client.js
:364:28)
at Client.handleReceivedData (/home/svaheguru2242/cloudxlab/spark/projects/real-time-analytics-dashboard/node/node_modules/kafka-node/lib/
client.js:587:18)
at Socket. (/home/svaheguru2242/cloudxlab/spark/projects/real-time-analytics-dashboard/node/node_modules/kafka-node/lib/client.
js:550:14)
at Socket.emit (events.js:95:17)
at Socket. (_stream_readable.js:765:14)
at Socket.emit (events.js:92:17)
at emitReadable_ (_stream_readable.js:427:10)
Hi Sachin,
Let me check it. Can you please let me know your topic name in kafka?
Hi Abhinav,
Topic name is order-data11 while pushing data into kafka from csv and rest is the same as explained in above blog.
Regards,
Sachin
Hi Sachin,
I have updated the code and guide.
Can you please check now? It should work.
Please keep me updated.
Hi folks,
we know that Apache Kafka is an open source distributed publish-subscribe messaging system and stream processing software platform built on hadoop to handle high volume of data. Written in Scala and Java.
It is widely used by the top companies like Twitter, LinkedIn, Netflix, Mozilla and Oracle for it unique nature like fast, scalable, and durable.
It’s 100% free to learn Apache kafka online
I wanted to ask if its possible to make an Apache Spark web application with frontend as angularjs. And can you please guide me through the stack and main steps?
— Please reply above this line —
Hi Muhammad,
It is difficult to make a web application using spark along but you can use spark on the server side.
—
Best,
Sandeep Giri
support@cloudxlab.com
you can use apache zeppelin, which uses angular js has front end 🙂
Awesome! Thank you
Thanks for sharing the descriptive information on Spark Tutorial. It’s really helpful to me since I’m taking Spark Training. Keep doing the good work and if you are interested to know more on Spark Tutorial, do check this Spark Tutorial.:-https://www.youtube.com/watch?v=dMDQz82FCqE