Covid-19 has been declared as a global pandemic. If you are interested to analyse the data by yourself, please follow the instructions below.
The data is made available to everyone at the locations given below.
The data files are in the form of four metrics and are available to download here:
Total confirmed cases:https://cowid.netlify.com/data/total_cases.csv
Total deaths:https://cowid.netlify.com/data/total_deaths.csv
New confirmed cases:https://cowid.netlify.com/data/new_cases.csv
New deaths:https://cowid.netlify.com/data/new_deaths.csv
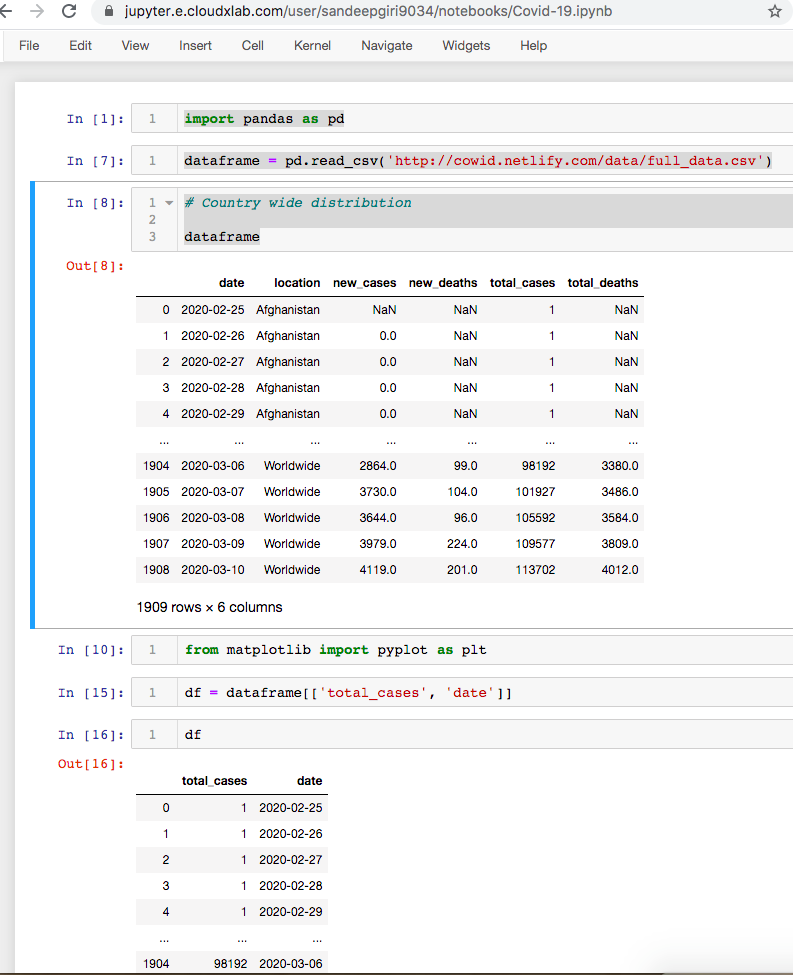
The full dataset is available to download here:http://cowid.netlify.com/data/full_data.csv
In your Jupyter notebook, please follow the instructions given below. To avoid installations of Jupyter or any library, you can simply use CloudxLab – it gives 15 days free subscription.
Import the Pandas library
import pandas as pd
Now, load the data into a DataFrame
dataframe = pd.read_csv('http://cowid.netlify.com/data/full_data.csv')Once the data has been loaded, you can perform various operations on it. Please see the image attached below to get an idea of the entire process.
The code for this is available here: https://github.com/cloudxlab/covid19/blob/master/Covid-19.ipynb