Introduction
As everyone knows, Big Data is a term of fascination in the present-day era of computing. It is in high demand in today’s IT industry and is believed to revolutionize technical solutions like never before.
Upon learning the big data concepts, we will get a vivid picture of the need for clusters of machines (distributed systems), and appreciate the use of this architecture in solving critical problems associated with storing and processing humungous data. In addition, we will get an idea of system design concepts, which aid us in designing scalable and resilient systems – the most desirable kind of systems any product-based company would desire to have for them. System design concepts are – for this reason – one of the most important topics for interviews at product-based companies. There is a booming number of job opportunities related to big data, and this is the reason everyone is excited about learning big data concepts.
But for a newbie, this word might also often sound daunting. But no worries! In this series of blog posts on big data, we will explore the theory of big data systems, how they are designed, how various tools – which deal with various ways of dealing with big data – co-exist in a big data environment, and practical implementation of how to use them. In particular, we will concentrate on Apache Hadoop and Spark, a very famous big data technology.
In today’s post, we are going to get introduced to big data from very scratch. This chapter doesn’t require any knowledge of programming or technology. We believe it is very useful for everyone to learn the basics of Big Data. So, jump in!
Note: If you are a good listener and prefer to watch a video rather than read through this post, please check out the corresponding video here.
Goals
In this chapter, we learn the basics of Big Data which include about:
- Types of data
- Distributed systems
- What is Big Data
- Why do we need big data now
- Big Data applications
- Who are Big Data customers
Now that we have got a basic idea of the topic of our discussion, let move ahead to dive deeper.
Types of data
Before we learn about Big Data, it is important for us to know of various types of data. This gives us a better context for our learning process.
Data is largely classified as Structured, Semi-Structured, and Un-Structured.
If we know the fields as well as their datatype, then we call it structured. The data in relational databases such as MySQL, Oracle, or Microsoft SQL is an example of structured data.
The data in which we know the fields or columns but we do not know the datatypes, we call it semi-structured data. For example, data in CSV which is comma-separated values is known as semi-structured data.
If our data doesn’t contain columns or fields, we call it unstructured data. The data in the form of plain text files or logs generated on a server are examples of unstructured data.
The process of translating unstructured data into structured is known as ETL – Extract, Transform, and Load.
Distributed systems
When networked computers are utilized to achieve a common goal, it is known as a distributed system. The work gets distributed amongst many computers. The branch of computing that studies distributed systems is known as distributed computing. The purpose of distributed computing is to get the work done faster by utilizing many computers.

Most but not all the tasks can be performed using distributed computing.
What is Big Data?
In very simple words, Big Data is data of very big size which can not be processed with usual tools. And to process such data we need to have distributed architecture. This data could be structured or unstructured.
Generally, we classify the problems related to the handling of data into three buckets:
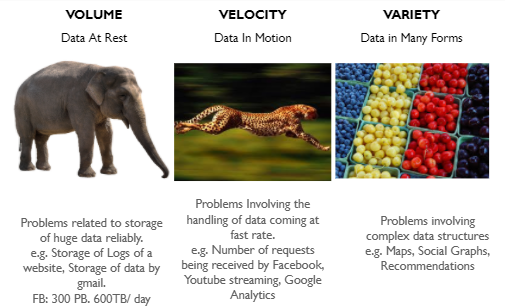
- Volume: When the problem we are solving is related to how we would store such huge data, we call it Volume. Examples of Volume are Facebook handling more than 500 TB data per day. Facebook is having 300 PB of data storage.
- Velocity: When we are trying to handle many requests per second, we call this characteristic Velocity. The problems as the number of requests received by Facebook or Google per second is an example of Big Data due to Velocity.
- Variety: If the problem at hand is complex or data that we are processing is complex, we call such problems as related to variety.
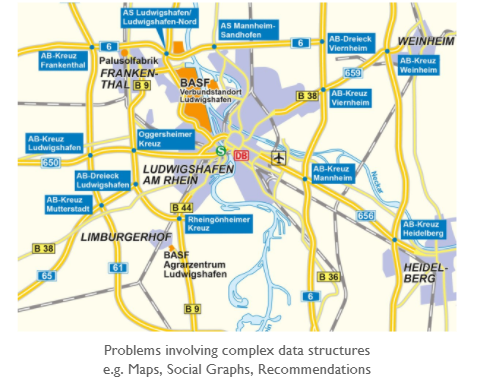
Imagine you have to find the fastest route on a map since the problem involves enumerating through many possibilities, it is a complex problem even though the map’s size would not be too huge.
Data could be termed as Big Data if either Volume, Velocity or Variety becomes impossible to handle using traditional tools.
Why do we need big data now?
Paper, Tapes etc are Analog storage while CDs, DVDs, hard disk drives are considered digital storage.
This graph shows that digital storage has started increasing exponentially after 2002 while Analog storage remained practically the same. The year 2002 is called the beginning of the digital age.
Why so? The answer is two fold: Devices, Connectivity On one hand, the devices became cheaper, faster and smaller. Smart Phone is a great example. On another, the connectivity improved. We have wifi, 4G, Bluetooth, NFC etc.
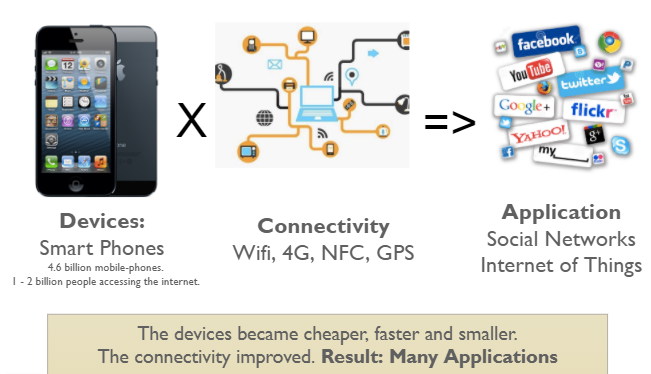
This lead to a lot of very useful applications such as a very vibrant world wide web, social networks, and Internet of things leading to huge data generation.
Roughly speaking, the computer is made of 4 components:
- CPU – Which executes instructions. CPU is characterized by its speed. The more the number of instructions it can execute per second, the faster it is considered.
- RAM – Random Access Memory. While processing, we load data into RAM. If we can load more data into RAM, CPU can perform better. So, RAM has two main attributes which matter: Size and its speed of reading and writing.
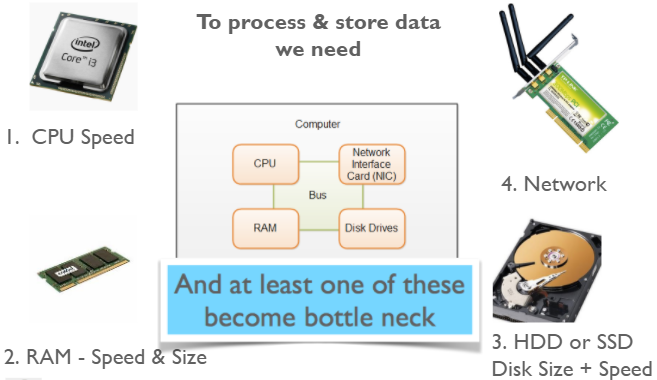
- Hard Disk – To permanently store data, we need hard disk drive or Solid State Drive. The SSD is faster but smaller and costlier. The faster and bigger the disk, the faster we can process data.
- Network – Another component that we frequently forget while thinking about the speed of computation is a network. Why? Often our data is stored on different machines and we need to read it over a network to process.
While processing Big Data at least one of these four components becomes the bottleneck. That’s where we need to move to multiple computers or distributed computing architecture.
Big Data Applications
So far we have tried to establish that while handling humongous data we would need new set of tools which can operate in a distributed fashion.
But who would be generating such data or who would need to process such humongous data? The quick answer is everyone.
Here are a few examples
- Recommendations:
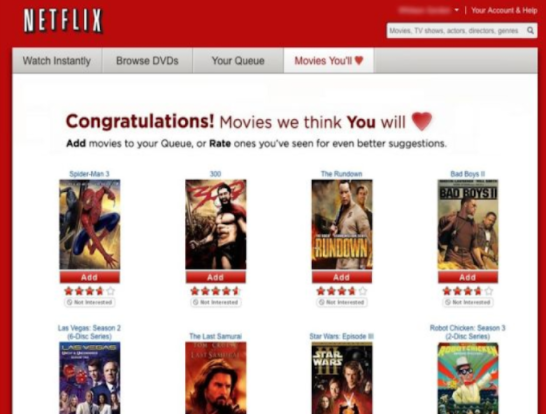
- In the e-commerce industry, the recommendation is a great example of Big Data processing. The application of recommendations, also known as collaborative filtering, is the process of suggesting someone a product based on their preferences or behavior.
- The e-commerce website would gather a lot of data about the customer’s behavior. In a very simplistic algorithm, we would basically try to find similar users and then cross-suggest the products. So, the more users, the better would be results.

- As per Amazon, a major chunk of their sales happens via recommendations on the website and email. The other big example of Big Data processing was Netflix’s 1 million dollar competition to generate movie recommendations.

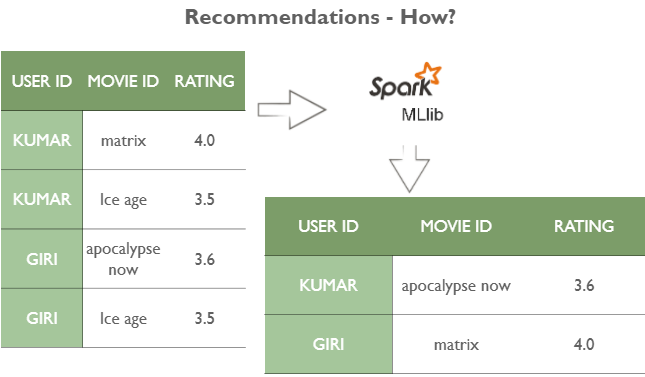
- As of today, generating recommendations have become pretty simple. The engines such as MLLib or Mahout have made it very simple to generate recommendations on humongous data. All you have to do is format the data in the three-column format: user id, movie id, and ratings.

- A/B testing:
- The idea of A/B testing is to compare two or more versions of the same thing and analyze which one works better. It not only helps us understand which version works better but also provides evidence to understand if the difference between the two versions is statistically significant or not.

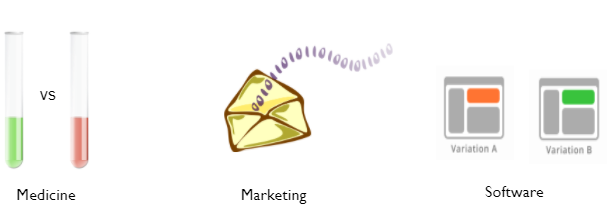
- Let us go back to the history of A/B testing. Earlier, in the 1950s, scientists and medical researchers started conducting A/B Testing to run clinical trials to test drug efficacy. In the 1960s and 1970s, marketers adopted this strategy to evaluate direct response campaigns. For instance, Would a postcard or a letter to target customers result in more sales? Later with the advent of the world wide web, the concept of A/B testing has also been adopted by the software industry to understand user preferences. So basically, the concept which was applied offline is now being applied online.

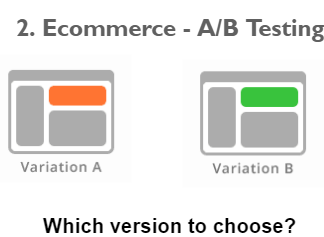
- Let us now understand why A/B testing is so important. In a real-world scenario, Companies might think that they know their customers well. For example, a company anticipates that variation B of the website would be more effective in making more sales compared to variation A. But in reality, users rarely behave as expected, and Variation A might lead to more sales. So to understand their users better, the companies rely on data-driven approaches. The companies analyze and understand the user behavior based on the user data they have. Thus, the more the data, the lesser the errors. This would in turn contribute to making reliable business decisions, which could lead to increased user engagement, improved user experience, boosting the company’s revenue, standing ahead of the competitors, and many more.

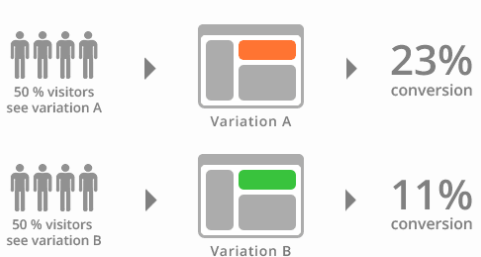
- Now let see more clearly see how it is done. Say we have an e-commerce website, and we want to see the impact of the Buy Now button of a product. We can randomly select 50% of the users to display the button with new color(say blue) and the remaining be shown the old(here green) colored button. We see that 23% of the people who were shown a new version of the button have bought the product, whereas only 11% of the people (who were shown the older button) ended up buying the product. Thus the newer version seems to be more effective.

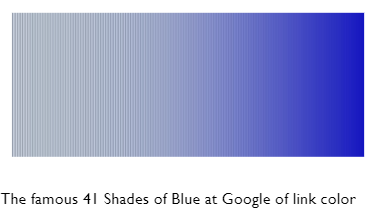
- Let us have a look at how some A/B testing cases lead to more effective decisions in the real world. In 2009, a team at Google can’t decide between two shades. So they tested 41 different shades of blue to decide which color to use for advertisement links in Gmail. The company showed each shade of blue to 1% of users. A slightly purple shade of blue got the maximum clicks, resulting in a $200 million boost of ad revenue. Likewise, Netflix, Amazon, Microsoft, and many others use A/B testing. At Amazon, we have many such experiments running all the time. Every feature is launched via A/B testing. It is first shown to say 1 percent of users and if it is performing well, we increase the percentages.

- The idea of A/B testing is to compare two or more versions of the same thing and analyze which one works better. It not only helps us understand which version works better but also provides evidence to understand if the difference between the two versions is statistically significant or not.
Who are Big Data customers?
There are many customers for big data. Let us have a look at some of them, and understand how each of the benefits from big data.
- Government:
Since governments have huge data about the citizens, any analysis would be Big Data analysis. The application is many.- The first is Fraud Detection. Be its anti-money laundering or user identification, the amount of data processing required is really high.
- In Cyber Security Welfare and Justice, Big Data is being generated and Big Data tools are getting adopted.
- Telecom:
- Telecom companies can use big data in order to understand why their customers are leaving and how they can prevent the customers from leaving. This is known as customer churn prevention. The data that could help in customer churn prevention is 1. How many calls did customers make to the call center? 2. For how long were they out of coverage area? 3. What was the usage pattern?
- The other use case is network performance optimization. Based on the past history of traffic, telecoms can forecast the network traffic and accordingly optimize the performance.
- The third most common use-case of Big Data in the telecommunications industry is Calling Data Record Analysis. Since there are millions of users of a telecom company and each user makes 100s of calls per day. Analyzing the calling Data records is a Big Data problem.
- Healthcare:
- Healthcare inherently has humongous data and complex problems to solve. Such problems can be solved with the new Big Data Technologies as supercomputers could not solve most of these problems.
- Few examples of such problems are Health information exchange, Gene sequencing, Healthcare improvements and Drug Safety.
Conclusions
Big Data is a new fuel that is driving many business decisions forward. It is able to yield positive, yet advanced solutions. Understanding the context of big data and using it wisely as per the use-cases would contribute to greater benefits. In this post, we discussed different types of data including structured, semi-structured, and unstructured data. Further, we understood that big data is a term coined based on the difficulties faced in dealing with data of humungous volume, handling high velocity or a variety of data. Having understood the significant impact of big data in various fields – like in the software industry, e-commerce, telecom, etc.- we are now in a state to appreciate the reason to study the subject.
Want to practice some MCQ’s or have a look at the videos on this topic? Feel free to visit here.
In the next post, we will understand the Big Data Solutions – Apache Hadoop and Spark. Most importantly, we will try to understand the basics of Apache Hadoop and have a walk-through of the Hadoop and Spark ecosystems.
Want to know more about CloudxLab Courses?


