Building Real-Time Analytics Dashboard Using Apache Spark

Apache Spark

In this blog post, we will learn how to build a real-time analytics dashboard using Apache Spark streaming, Kafka, Node.js, Socket.IO and Highcharts.

Complete Spark Streaming topic on CloudxLab to refresh your Spark Streaming and Kafka concepts to get most out of this guide.

Problem Statement

An e-commerce portal (http://www.aaaa.com) wants to build a real-time analytics dashboard to visualize the number of orders getting shipped every minute to improve the performance of their logistics.

Solution

Before working on the solution, let’s take a quick look at all the tools we will be using:

Apache Spark – A fast and general engine for large-scale data processing. It is 100 times faster than Hadoop MapReduce in memory and 10x faster on disk. Learn more about Apache Spark here

Python – Python is a widely used high-level, general-purpose, interpreted, dynamic programming language. Learn more about Python here

Kafka – A high-throughput, distributed, publish-subscribe messaging system. Learn more about Kafka here

Node.js – Event-driven I/O server-side JavaScript environment based on V8. Learn more about Node.js here

Socket.IO – Socket.IO is a JavaScript library for real-time web applications. It enables real-time, bi-directional communication between web clients and servers. Read more about Socket.IO here

Highcharts – Interactive JavaScript charts for web pages. Read more about Highcharts here

CloudxLab – Provides a real cloud-based environment for practicing and learn various tools. You can start practicing right away by just signing up online.

How To Build A Data Pipeline?

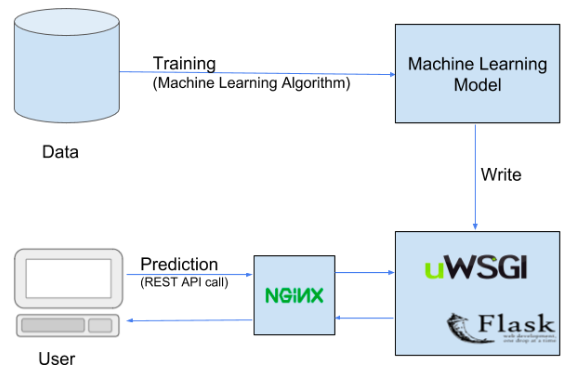
Below is the high-level architecture of the data pipeline
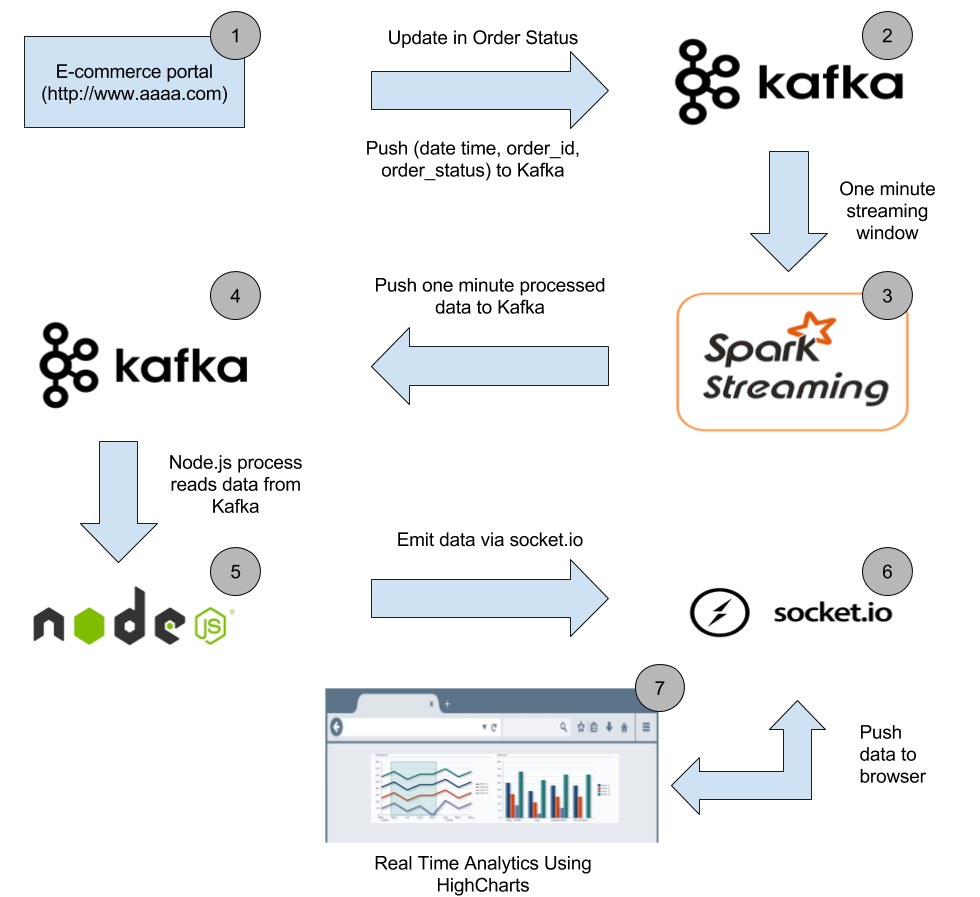
Data Pipeline
Data Pipeline

Our real-time analytics dashboard will look like this

Real-Time Analytics Dashboard

Continue reading “Building Real-Time Analytics Dashboard Using Apache Spark”

System Design: How to Design a Rate Limiter?

What is a Rate Limiter?

Rate limiting refers to preventing the frequency of an operation from exceeding a defined limit. In large-scale systems, rate limiting is commonly used to protect underlying services and resources. In distributed systems, Rate limiting is used as a defensive mechanism to protect the availability of shared resources. It is also used to protect APIs from unintended or malicious overuse by limiting the number of requests that can reach our API in a given period of time.

In this blog, we’ll see how will tackle the question of designing a rate limiter in a system design interview.

Continue reading “System Design: How to Design a Rate Limiter?”

Top Machine Learning Interview Questions for 2024 (Part-1)


These Machine Learning Interview Questions, are the real questions that are asked in the top interviews.

For hiring machine learning engineers or data scientists, the typical process has multiple rounds.

  1. A basic screening round – The objective is to check the minimum fitness in this round.
  2. Algorithm Design Round – Some companies have this round but most don’t. This involves checking the coding / algorithmic skills of the interviewee.
  3. ML Case Study – In this round, you are given a case study problem of machine learning on the lines of Kaggle. You have to solve it in an hour.
  4. Bar Raiser / Hiring Manager  – This interview is generally with the most senior person in the team or a very senior person from another team (at Amazon it is called Bar raiser round) who will check if the candidate fits in the company-wide technical capabilities. This is generally the last round.

Continue reading “Top Machine Learning Interview Questions for 2024 (Part-1)”

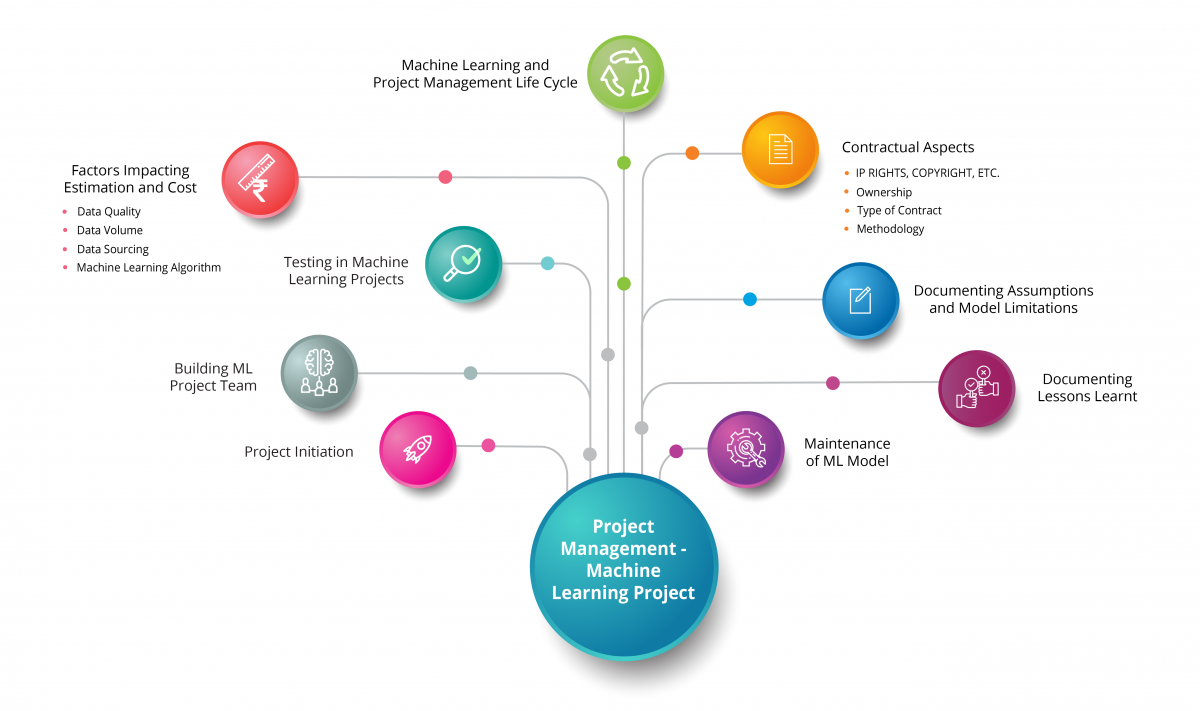
Things to Consider While Managing Machine Learning Projects

Generally, Machine Learning (or Deep Learning) projects are quite unique and also different from traditional web application projects due to the inherent complexity involved with them.

The goal of this article is, not to go through full project management life cycle, but to discuss a few complexities and finer points which may impact different project management phases and aspects of a Machine Learning(or Deep Learning) project, and, which should be taken care of, to avoid any surprises later.

Below is a quick ready reckoner for the topics that we will be discussing in this article.

Continue reading “Things to Consider While Managing Machine Learning Projects”

Deploying Machine Learning model in production

In this article, I am going to explain steps to deploy a trained and tested Machine Learning model in production environment.

Though, this article talks about Machine Learning model, the same steps apply to Deep Learning model too.

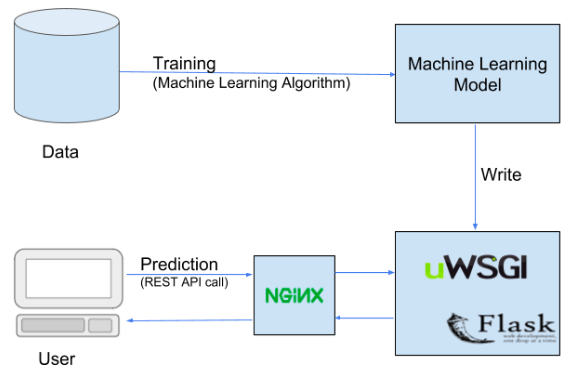
Below is a typical setup for deployment of a Machine Learning model, details of which we will be discussing in this article.

Process to build and deploy a REST service (for ML model) in production

The complete code for creating a REST service for your Machine Learning model can be found at the below link:

https://github.com/cloudxlab/ml/tree/master/projects/deploy_mnist

Let us say, you have trained, fine-tuned and tested Machine Learning(ML) model – sgd_clf, which was trained and tested using SGD Classifier on MNIST dataset.  And now you want to deploy it in production, so that consumers of this model could use it. What are different options you have to deploy your ML model in production?

Continue reading “Deploying Machine Learning model in production”

Fashion-MNIST using Machine Learning

One of the classic problem that has been used in the Machine Learning world for quite sometime is the MNIST problem. The objective is to identify the digit based on image. But MNIST is not very great problem because we come up with great accuracy even if we are looking at few pixels in the image. So, another common example problem against which we test algorithms is Fashion-MNIST.

The complete code for this project you can find here : https://github.com/cloudxlab/ml/tree/master/projects/Fashion-MNIST

Fashion-MNIST is a dataset of Zalando’s fashion article images —consisting of a training set of 60,000 examples and a test set of 10,000 examples. Each instance is a 28×28 grayscale image, associated with a label.

Continue reading “Fashion-MNIST using Machine Learning”

Phrase matching using Apache Spark

Recently, a friend whose company is working on large scale project reached out to us to seek a solution to a simple problem of finding a list of phrases (approximately 80,000) in a huge set of rich text documents (approx 6 million).

The problem at first looked simple. The way engineers had solved it is by simply loading the two documents in Apache Spark’s DataFrame and joining those using “like”. Something on these lines:

select phrase.id, docs.id from phrases, docs where docs.txt like ‘%’ + phrases.phrase + ‘%’

But it was taking huge time even on the small subset of the data and processing is done in distributed fashion. Any Guesses, why?

They had also tried to use Apache Spark’s broadcast mechanism on the smaller dataset but still, it was taking a long while finishing even a small task.

Continue reading “Phrase matching using Apache Spark”

AutoQuiz: Generating ‘Fill in the Blank’ Type Questions with NLP

Can a machine create quiz which is good enough for testing a person’s knowledge of a subject?

So, last Friday, we wrote a program which can create simple ‘Fill in the blank’ type questions based on any valid English text.

This program basically figures out sentences in a text and then for each sentence it would first try to delete a proper noun and if there is no proper noun, it deletes a noun.

We are using textblob which is basically a wrapper over NLTK – The Natural Language Toolkit, or more commonly NLTK, is a suite of libraries and programs for symbolic and statistical natural language processing for English written in the Python programming language.

Continue reading “AutoQuiz: Generating ‘Fill in the Blank’ Type Questions with NLP”

Predicting Income Level, An Analytics Casestudy in R

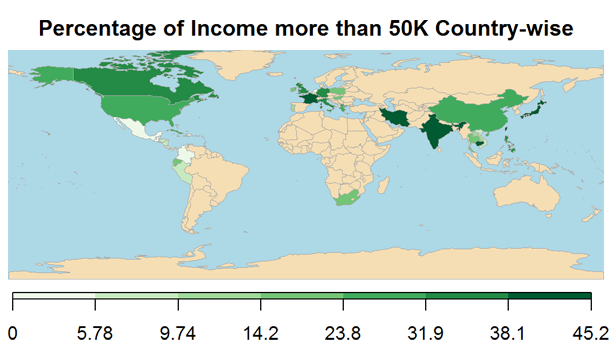
Percentage of Income more than 50k Country wise

1. Introduction

In this data analytics case study, we will use the US census data to build a model to predict if the income of any individual in the US is greater than or less than USD 50000 based on the information available about that individual in the census data.

The dataset used for the analysis is an extraction from the 1994 census data by Barry Becker and donated to the public site http://archive.ics.uci.edu/ml/datasets/Census+Income. This dataset is popularly called the “Adult” data set. The way that we will go about this case study is in the following order:

  1. Describe the data- Specifically the predictor variables (also called independent variables features) from the Census data and the dependent variable which is the level of income (either “greater than USD 50000” or “less than USD 50000”).
  2. Acquire and Read the data- Downloading the data directly from the source and reading it.
  3. Clean the data- Any data from the real world is always messy and noisy. The data needs to be reshaped in order to aid exploration of the data and modeling to predict the income level.
  4. Explore the independent variables of the data- A very crucial step before modeling is the exploration of the independent variables. Exploration provides great insights to an analyst on the predicting power of the variable. An analyst looks at the distribution of the variable, how variable it is to predict the income level, what skews it has, etc. In most analytics project, the analyst goes back to either get more data or better context or clarity from his finding.
  5. Build the prediction model with the training data- Since data like the Census data can have many weak predictors, for this particular case study I have chosen the non-parametric predicting algorithm of Boosting. Boosting is a classification algorithm (here we classify if an individual’s income is “greater than USD 50000” or “less than USD 50000”) that gives the best prediction accuracy for weak predictors. Cross validation, a mechanism to reduce over fitting while modeling, is also used with Boosting.
  6. Validate the prediction model with the testing data- Here the built model is applied on test data that the model has never seen. This is performed to determine the accuracy of the model in the field when it would be deployed. Since this is a case study, only the crucial steps are retained to keep the content concise and readable.

Continue reading “Predicting Income Level, An Analytics Casestudy in R”