In this blog post, we will learn how to build a real-time analytics dashboard using Apache Spark streaming, Kafka, Node.js, Socket.IO and Highcharts.
Complete Spark Streaming topic on CloudxLab to refresh your Spark Streaming and Kafka concepts to get most out of this guide.
Problem Statement
An e-commerce portal (http://www.aaaa.com) wants to build a real-time analytics dashboard to visualize the number of orders getting shipped every minute to improve the performance of their logistics.
Solution
Before working on the solution, let’s take a quick look at all the tools we will be using:
Apache Spark – A fast and general engine for large-scale data processing. It is 100 times faster than Hadoop MapReduce in memory and 10x faster on disk. Learn more about Apache Spark here
Python – Python is a widely used high-level, general-purpose, interpreted, dynamic programming language. Learn more about Python here
Kafka – A high-throughput, distributed, publish-subscribe messaging system. Learn more about Kafka here
Node.js – Event-driven I/O server-side JavaScript environment based on V8. Learn more about Node.js here
Socket.IO – Socket.IO is a JavaScript library for real-time web applications. It enables real-time, bi-directional communication between web clients and servers. Read more about Socket.IO here
Highcharts – Interactive JavaScript charts for web pages. Read more about Highcharts here
CloudxLab – Provides a real cloud-based environment for practicing and learn various tools. You can start practicing right away by just signing up online.
How To Build A Data Pipeline?
Below is the high-level architecture of the data pipeline
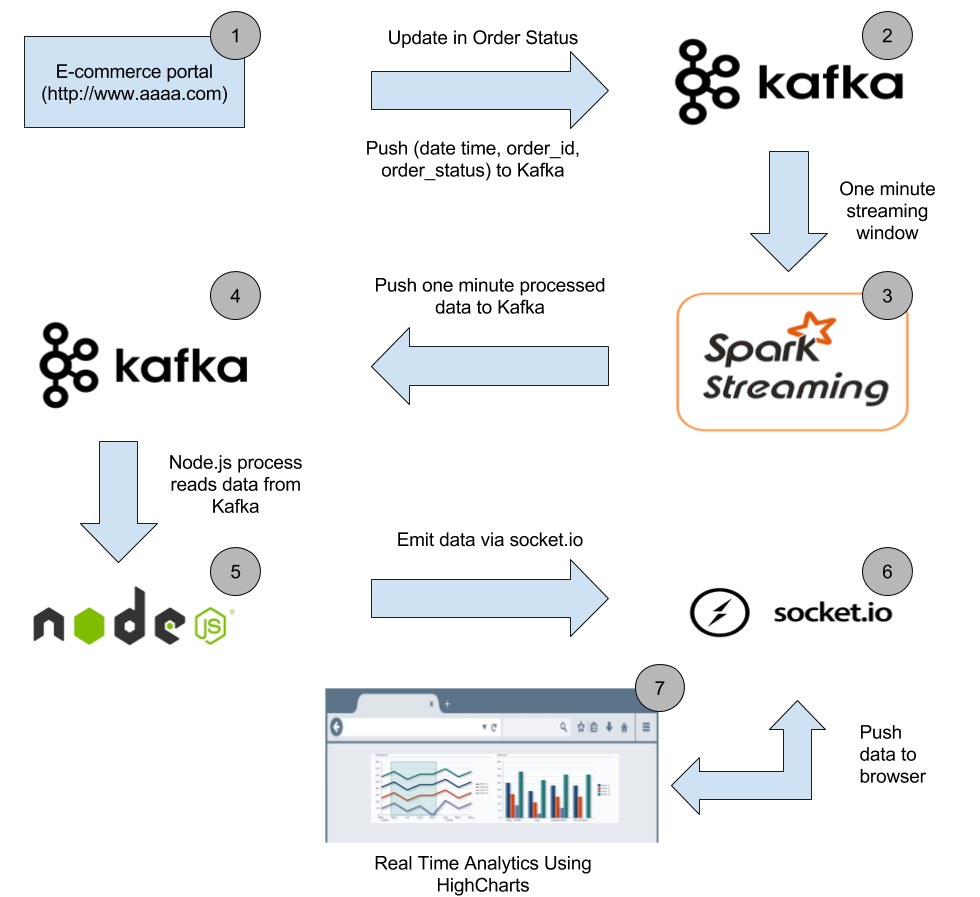
Our real-time analytics dashboard will look like this

Continue reading “Building Real-Time Analytics Dashboard Using Apache Spark”
